Throughput
Throughput benchmarks are a Go port of the Caffeine benchmarks.
Description
The benchmark that I use has a pre-populated cache with a zipf distribution for the access requests. That creates hot spots as some entries are used much more often than others, just like a real cache would experience. A common mistake is a uniform policy (distribution consisting of unique elements) which evenly spreads the contention, which would imply random replacement is the ideal policy. A skewed distribution means that locks suffer higher contention so it exacerbates that as a problems, while also benefiting contention-free implementations who can better utilize the cpu cache.
The benchmark's overhead is thread-local work for an index increment, array lookup, loop, and operation counter. If we introduce a cost like data dependencies (such as by using a random number generator to select the next key), we'd see this fall sharply as we no longer allow the CPU/compiler to use the hardware's full potential.
Also in benchmarks, the cache initially fully populated because a cache miss always takes much less time than a hit, since you don't need to update the eviction policy. Because of this, implementations with a small hit ratio get a huge advantage and as a result it is easy to misinterpret the results of such benchmarks.
In the end, I think this is one of the best benchmarks to compare cache speeds because this micro-benchmark tries to isolate the costs to only measuring the cache in a concurrent workload. It would show bottlenecks such as due to hardware cache coherence, data dependencies, poor branch prediction, saturation of the logic units (there are multiple ALUs for every FP unit), (lack of) SIMD, waits on the store buffer, blocking and context switches, system calls, inefficient algorithms, etc.
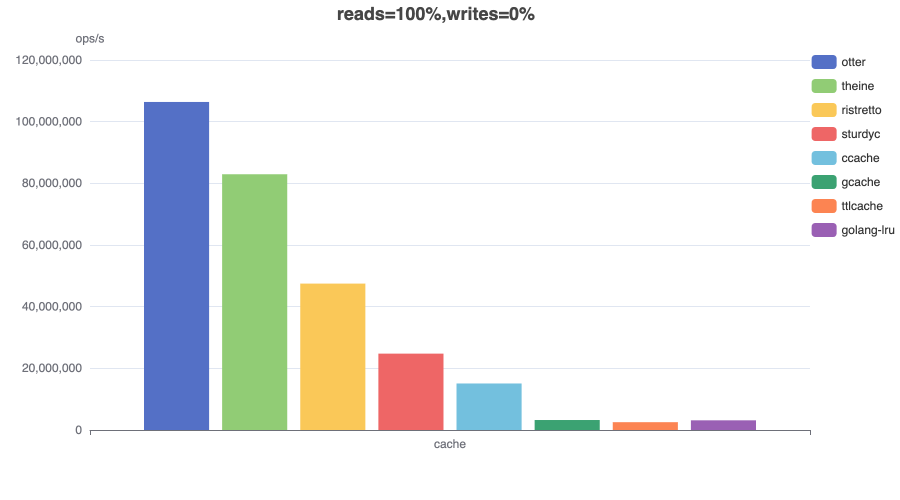
Read (100%)
In this benchmark 8 threads concurrently read from a cache configured with a maximum size.
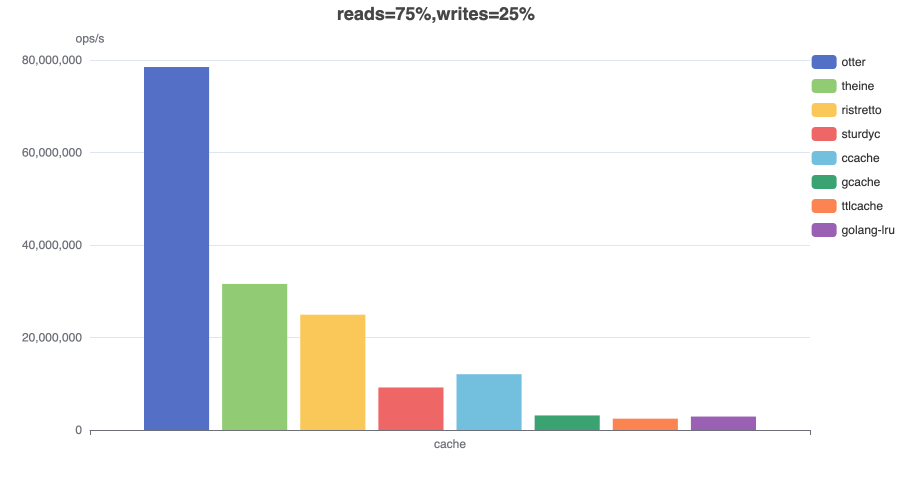
Read (75%) / Write (25%)
In this benchmark 6 threads concurrently read from and 2 threads write to a cache configured with a maximum size.
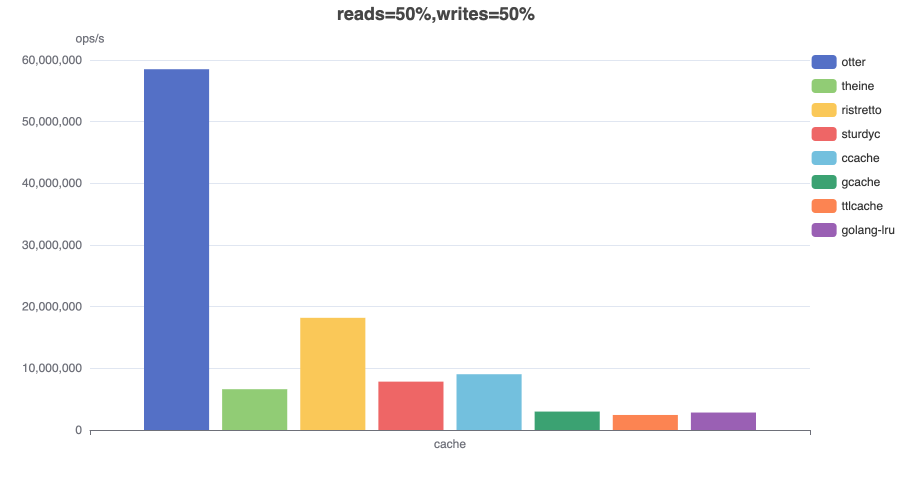
Read (50%) / Write (50%)
In this benchmark 4 threads concurrently read from and 4 threads write to a cache configured with a maximum size.
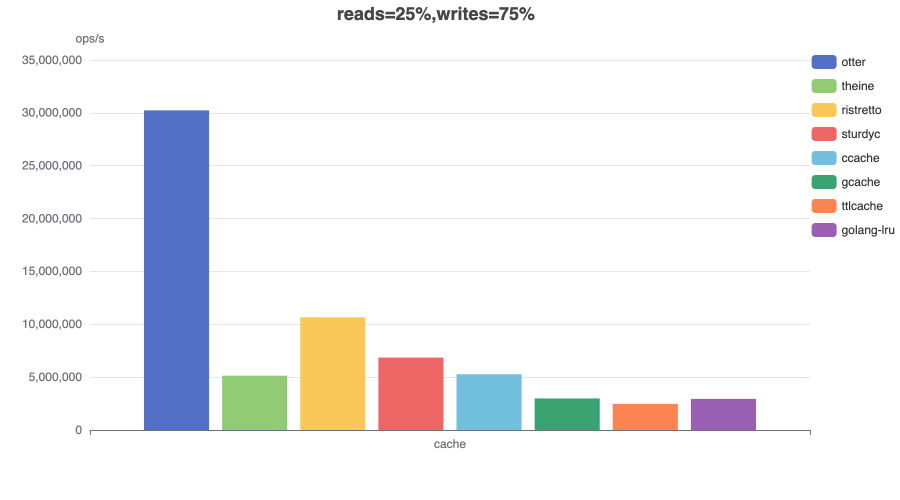
Read (25%) / Write (75%)
In this benchmark 2 threads concurrently read from and 6 threads write to a cache configured with a maximum size.
Write (100%)
In this benchmark 8 threads concurrently write to a cache configured with a maximum size.
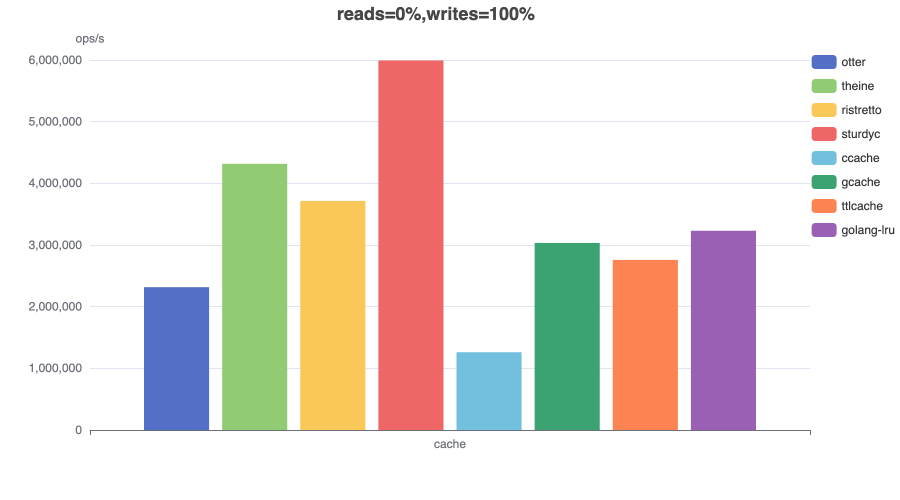
Conclusion
Otter maintains excellent throughput under high contention across all workload types, except extreme write-heavy (update-heavy) scenarios. However, such workloads are uncommon for caches, as they typically indicate an inherently low hit rate and usually cache misses are inserts, not updates.
Eviction
A benchmark that evaluates the eviction performance of a cache. The cache is prepopulated for a 100% eviction rate to mimic worst-case behavior (100% inserts). This benchmark should not be used to compare cache speeds, but it may reveal some interesting issues.
capacity=100
goos: darwin
goarch: arm64
pkg: github.com/maypok86/otter/v2/benchmarks/eviction
cpu: Apple M1 Pro
BenchmarkCache
BenchmarkCache/otter_capacity=100
BenchmarkCache/otter_capacity=100-10             3898776           307.5 ns/op     3251920 ops/s          41 B/op          1 allocs/op
BenchmarkCache/theine_capacity=100
BenchmarkCache/theine_capacity=100-10            2690583           425.9 ns/op     2348010 ops/s          80 B/op          1 allocs/op
BenchmarkCache/ristretto_capacity=100
BenchmarkCache/ristretto_capacity=100-10        27816357            44.95 ns/op   22246427 ops/s          68 B/op          1 allocs/op
BenchmarkCache/golang-lru_capacity=100
BenchmarkCache/golang-lru_capacity=100-10        4476072           266.6 ns/op     3750443 ops/s          64 B/op          1 allocs/op
BenchmarkCache/gcache_capacity=100
BenchmarkCache/gcache_capacity=100-10            3380430           376.6 ns/op     2655666 ops/s         120 B/op          3 allocs/op
BenchmarkCache/ttlcache_capacity=100
BenchmarkCache/ttlcache_capacity=100-10          4002375           290.8 ns/op     3438486 ops/s         128 B/op          2 allocs/op
capacity=10000
goos: darwin
goarch: arm64
pkg: github.com/maypok86/otter/v2/benchmarks/eviction
cpu: Apple M1 Pro
BenchmarkCache
BenchmarkCache/otter_capacity=10000
BenchmarkCache/otter_capacity=10000-10           3020878           342.2 ns/op     2922559 ops/s          41 B/op          1 allocs/op
BenchmarkCache/theine_capacity=10000
BenchmarkCache/theine_capacity=10000-10          2648924           465.2 ns/op     2149415 ops/s          80 B/op          1 allocs/op
BenchmarkCache/ristretto_capacity=10000
BenchmarkCache/ristretto_capacity=10000-10      25218223            50.80 ns/op   19686347 ops/s          69 B/op          1 allocs/op
BenchmarkCache/golang-lru_capacity=10000
BenchmarkCache/golang-lru_capacity=10000-10      2870298           396.6 ns/op     2521622 ops/s          64 B/op          1 allocs/op
BenchmarkCache/gcache_capacity=10000
BenchmarkCache/gcache_capacity=10000-10          3519871           373.7 ns/op     2675902 ops/s         120 B/op          3 allocs/op
BenchmarkCache/ttlcache_capacity=10000
BenchmarkCache/ttlcache_capacity=10000-10        3601334           321.4 ns/op     3111849 ops/s         128 B/op          2 allocs/op
PASS
capacity=1000000
goos: darwin
goarch: arm64
pkg: github.com/maypok86/otter/v2/benchmarks/eviction
cpu: Apple M1 Pro
BenchmarkCache
BenchmarkCache/otter_capacity=1000000
BenchmarkCache/otter_capacity=1000000-10             2432457           417.0 ns/op     2398029 ops/s          32 B/op          1 allocs/op
BenchmarkCache/theine_capacity=1000000
BenchmarkCache/theine_capacity=1000000-10            2130484           578.4 ns/op     1728787 ops/s          80 B/op          1 allocs/op
BenchmarkCache/ristretto_capacity=1000000
BenchmarkCache/ristretto_capacity=1000000-10        16660399            64.80 ns/op   15431051 ops/s          77 B/op          1 allocs/op
BenchmarkCache/golang-lru_capacity=1000000
BenchmarkCache/golang-lru_capacity=1000000-10        2655174           461.0 ns/op     2169356 ops/s          64 B/op          1 allocs/op
BenchmarkCache/gcache_capacity=1000000
BenchmarkCache/gcache_capacity=1000000-10            2908304           424.4 ns/op     2356435 ops/s         120 B/op          3 allocs/op
BenchmarkCache/ttlcache_capacity=1000000
BenchmarkCache/ttlcache_capacity=1000000-10          2409374           483.7 ns/op     2067315 ops/s         128 B/op          2 allocs/op
PASS
Conclusion
Otter demonstrated quite good performance, even though it inherently has a harder time handling a 100% insert workload compared to simple mutex-protected LRU caches (golang-lru, ttlcache, gcache). The reason is that Otter uses a more sophisticated eviction policy, which takes more time to make eviction decisions. Additionally, in this case, the write buffer doesn’t help much simply because we can’t gain time by delaying writes—each one is quickly followed by many others. Otter also allocates the least amount of memory.
Theine showed acceptable eviction speed since your system is unlikely to ever exceed 2 million misses per second.
Ristretto delivered fantastic speed, but unfortunately, this is achieved by dropping inserts due to contention. Whether you need this feature is up to you. Just keep in mind that such drops can lead to a significant drop in hit rate under heavy load.
Gcache, ttlcache, and golang-lru were added as baseline comparisons against a simple mutex-protected map with LRU, so no further comments here.